KickCast
2026 World Cup prediction · calibration-first ML
Turns a 21,371-match feature matrix into 10,000-run Monte-Carlo odds for every one of the 104 games of the 2026 World Cup: full probability distributions, not a single guess.
Runs in your browser on synthetic data. Deterministic (seeded), so the same inputs always give the same forecast.
Press Run simulation to run 8,000 synthetic knockout tournaments (in-browser sample) and rank teams by how often they lift the trophy.
Synthetic, illustrative ratings, not the live KickCast model or a published forecast. The real product uses a 7-model ensemble over decades of match data.
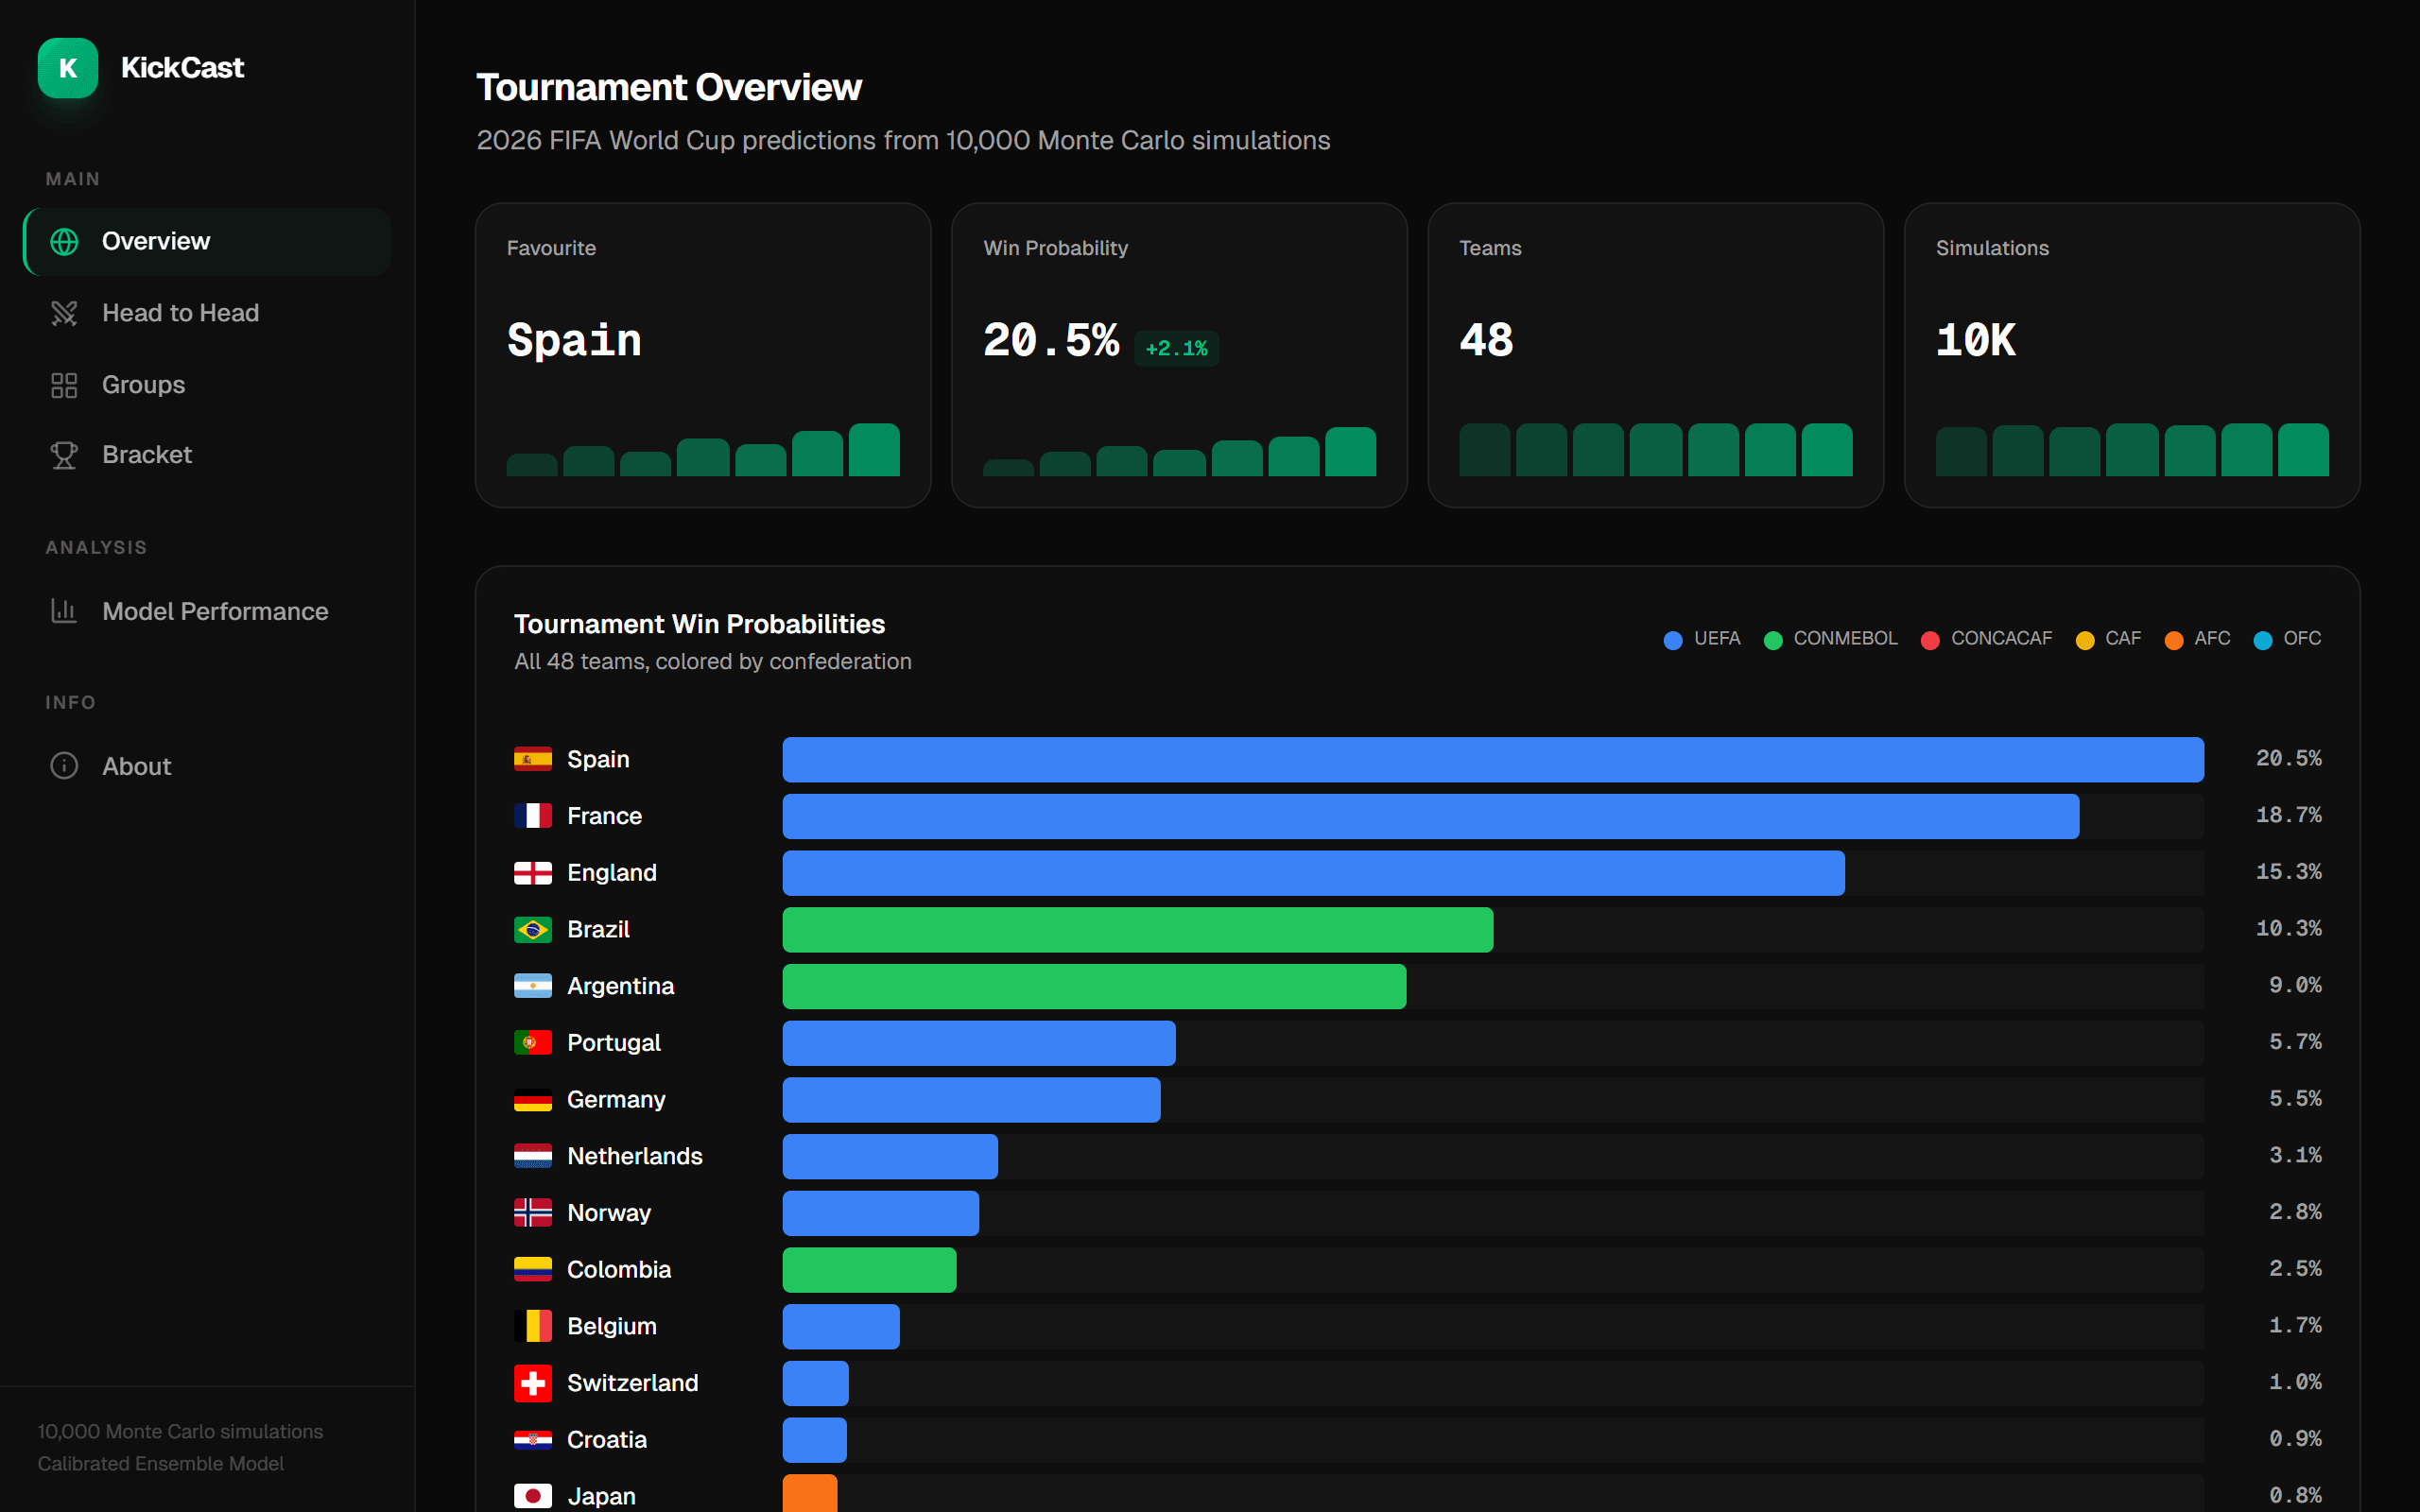
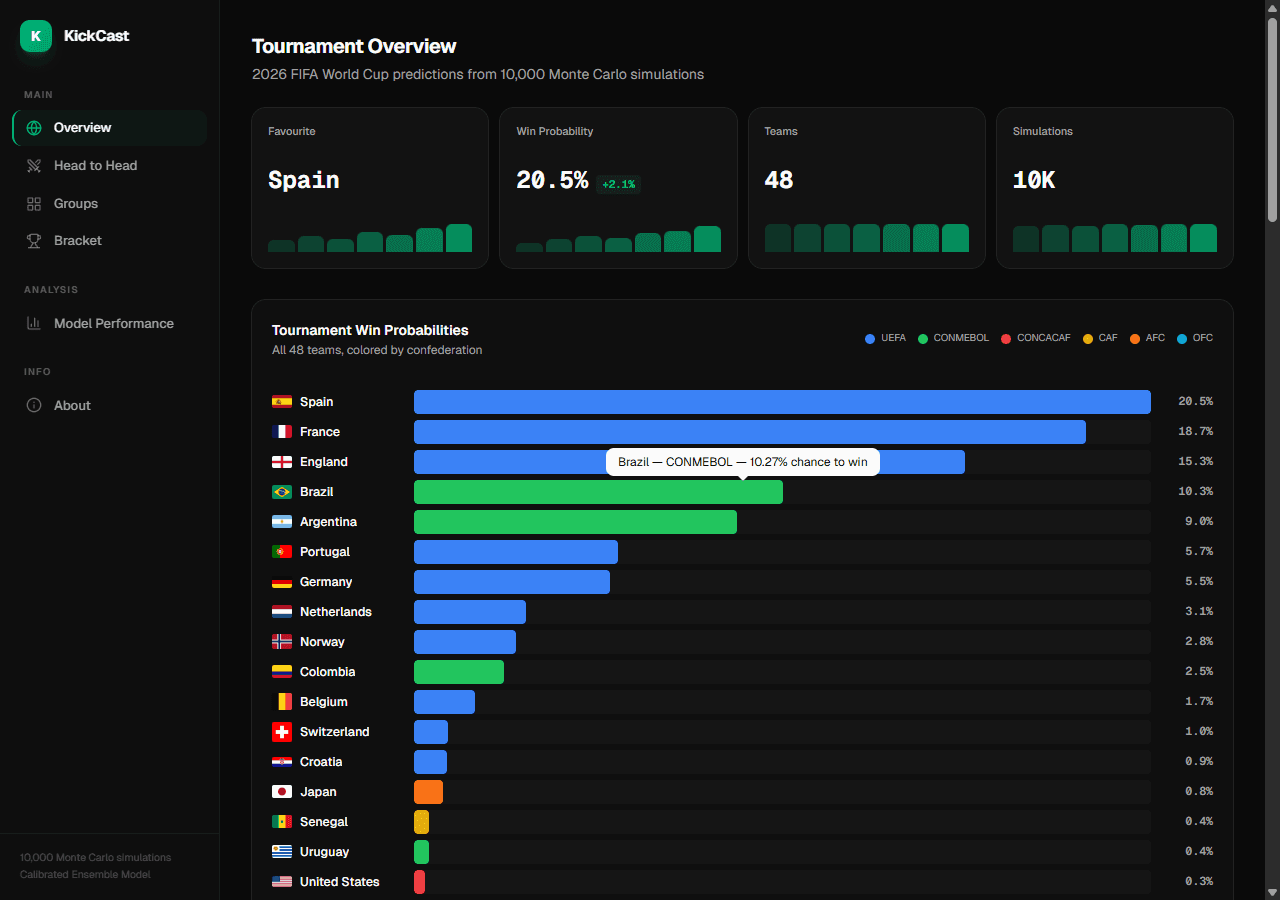
- 1Spain20.52%
- 2France18.71%
- 3England15.34%
- 4Brazil10.27%
- 5Argentina9.00%
- 6Portugal5.68%
Published KickCastNet_v3 forecast: 10,000-run Monte Carlo. Same data as the live dashboard, not produced by the simulator above.
8,000-run in-browser sample on synthetic data. The published model ran 10,000 iterations.
KickCast, a graduate machine-learning course project, turns historical match data into tournament odds: an ensemble of classifiers predicts each match, and the class probabilities drive a 10,000-iteration Monte-Carlo simulation that samples goals via Poisson and runs the full group + knockout bracket into per-team advancement odds, served as a deployed Next.js dashboard.
The pipeline is leakage-safe: it loads Elo, FIFA rankings, market values, manager records, injuries, form and head-to-head history into a 21,371-row × 38-feature matrix with chronological train/val/test splits (test = the 2022 World Cup).
Modeling covers seven classical models (Logistic Regression, KNN, Random Forest, XGBoost, HistGradientBoosting, SVM-RBF and a stacking ensemble) alongside LightGBM/CatBoost variants and a custom PyTorch 'KickCastNet' tuned with Optuna, handling class imbalance with balanced weights and SMOTE. SHAP attributes the signal (Elo difference is the single strongest predictor, |r|=0.504).
- Python
- scikit-learn
- XGBoost
- LightGBM
- PyTorch
- Optuna
- SHAP
- Monte Carlo
- Next.js
- Vercel
Architecture · notebook → tournament odds
Feature engineering
Elo, FIFA rankings, market values, form, injuries and head-to-head → a 21,371 × 38 matrix with leakage-safe chronological splits (test = the 2022 World Cup).
Model ensemble
Seven classical models + LightGBM/CatBoost + a PyTorch net (KickCastNet), tuned with Optuna; class imbalance handled with balanced weights + SMOTE.
Explainability
SHAP attributes the signal: Elo difference is the single strongest predictor (|r| = 0.504).
Monte-Carlo simulation
3-class probabilities drive 10,000 iterations that sample goals via Poisson through the full 48-team group + knockout bracket.
Live dashboard
Per-team advancement odds served as a deployed Next.js dashboard.
- Models
- 7 classifiers + PyTorch net
- Monte Carlo
- 10,000 iterations
Where the numbers come from
Four accuracy figures, one story…
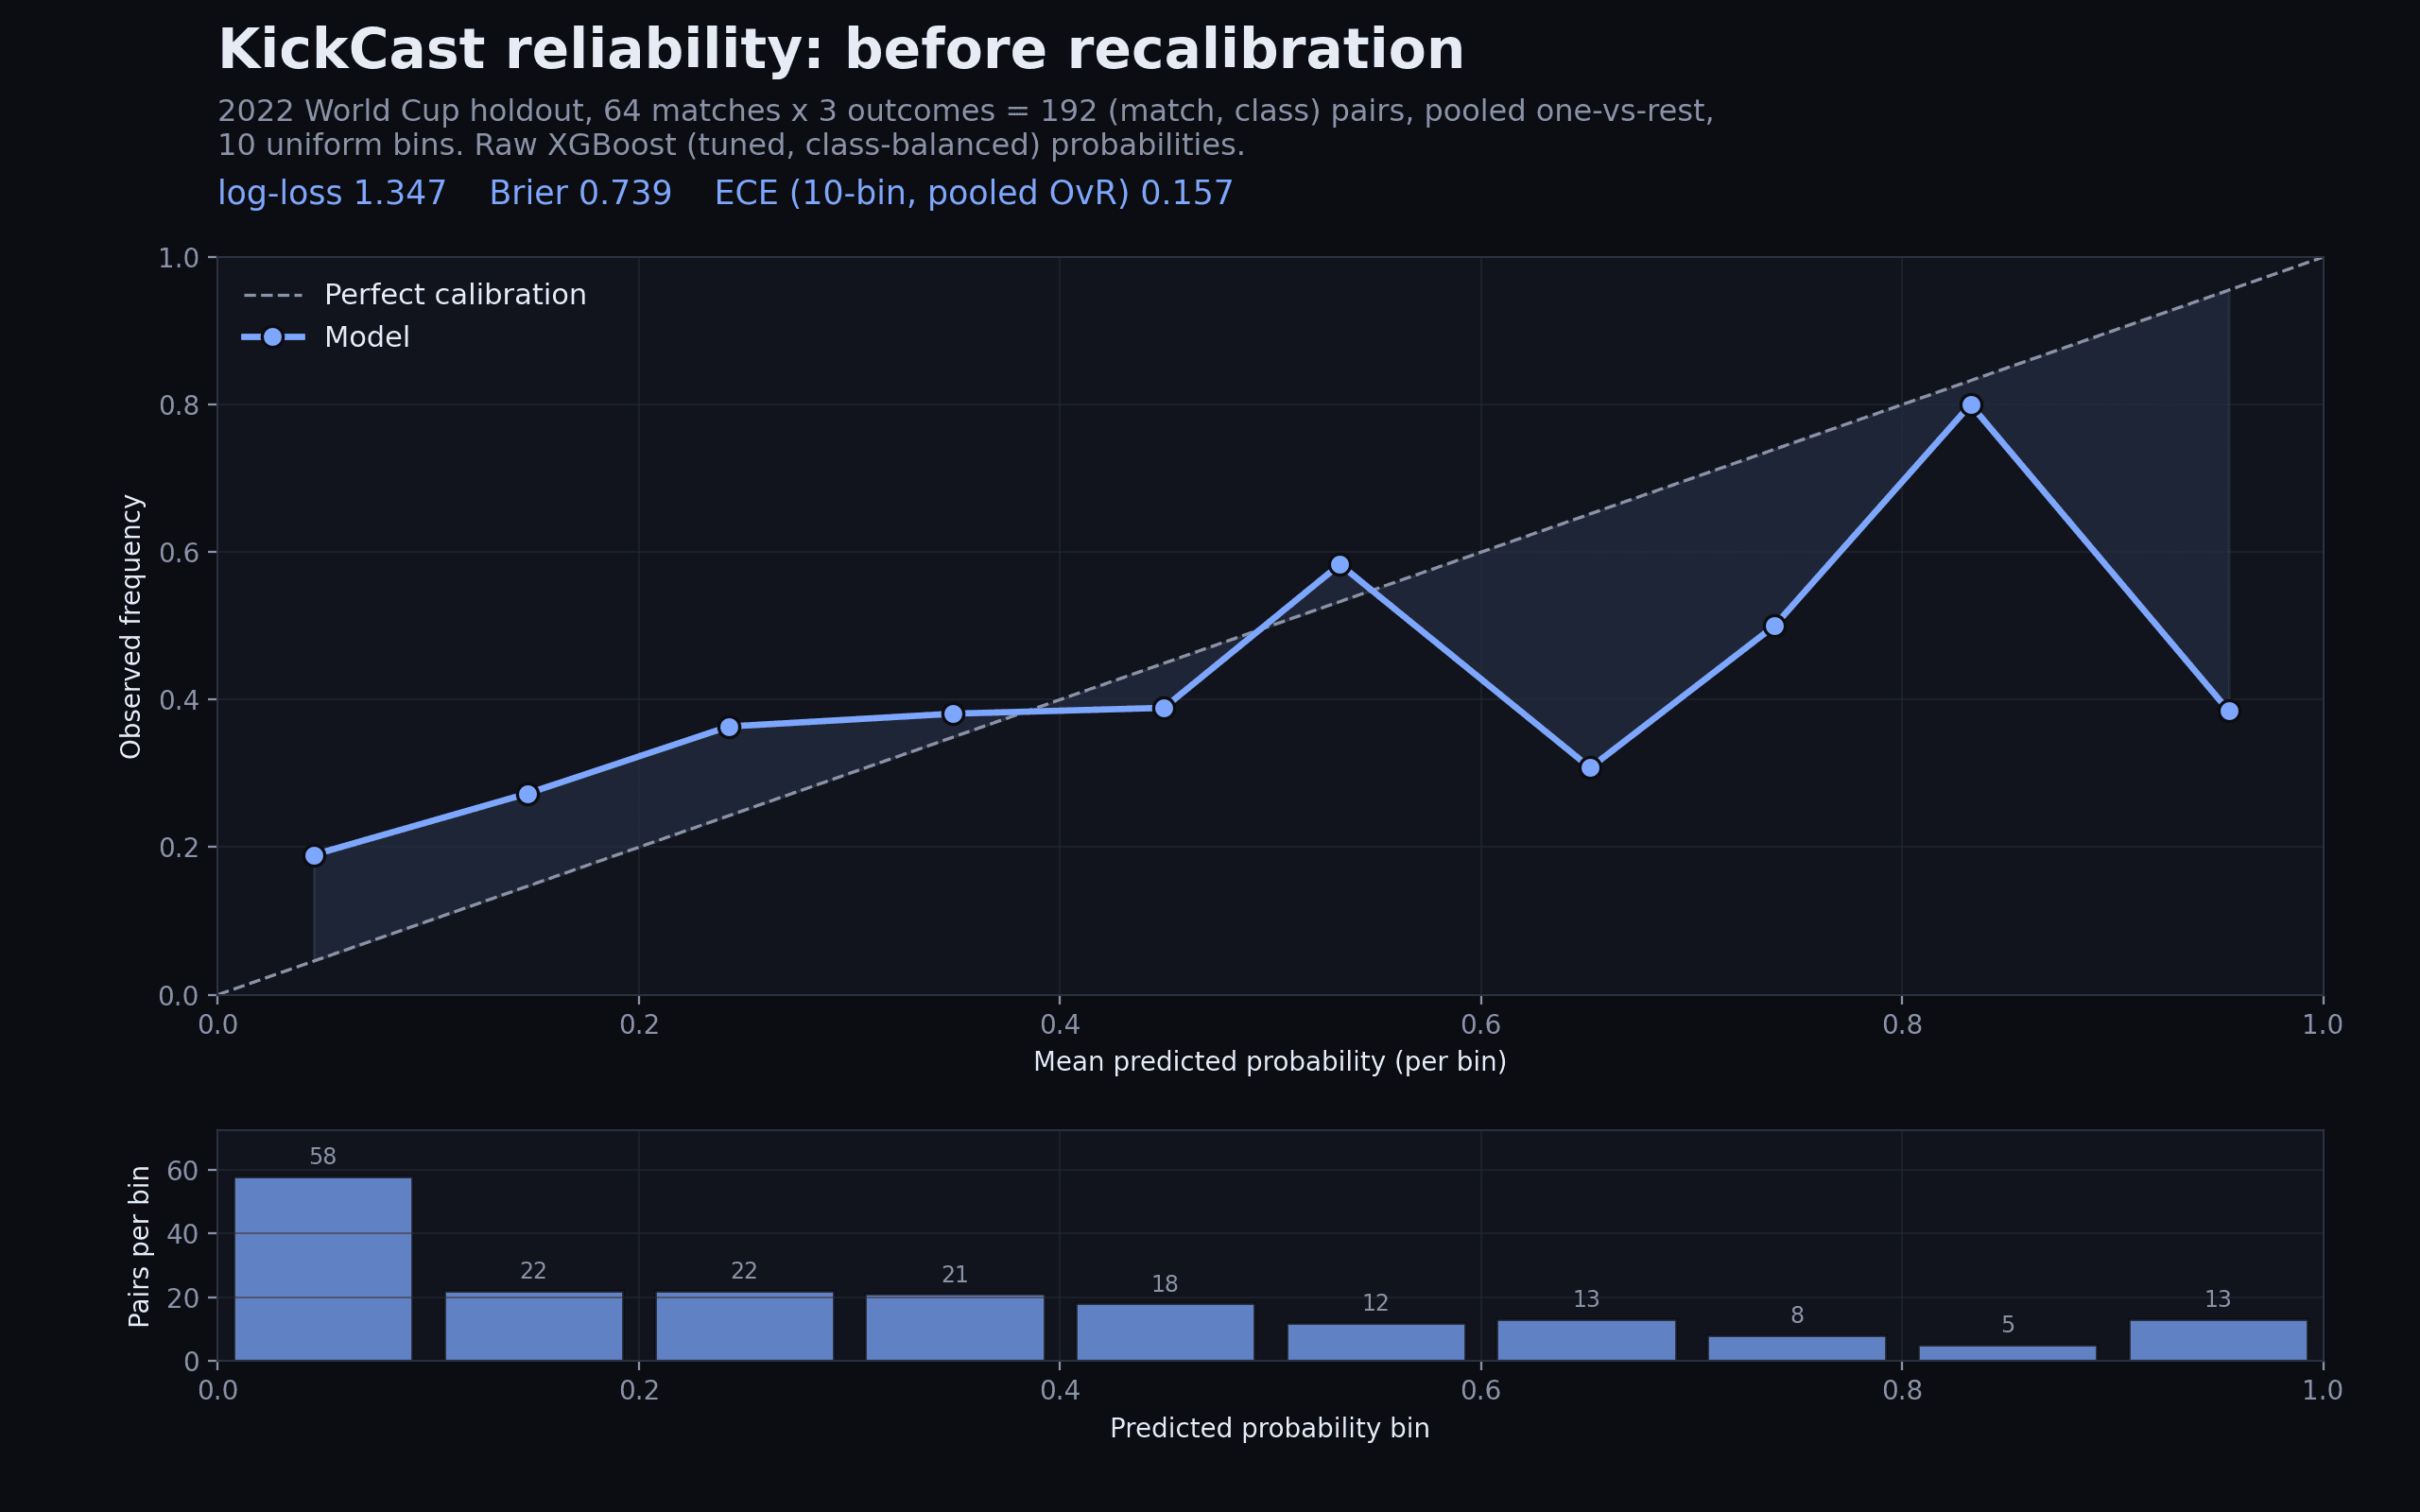
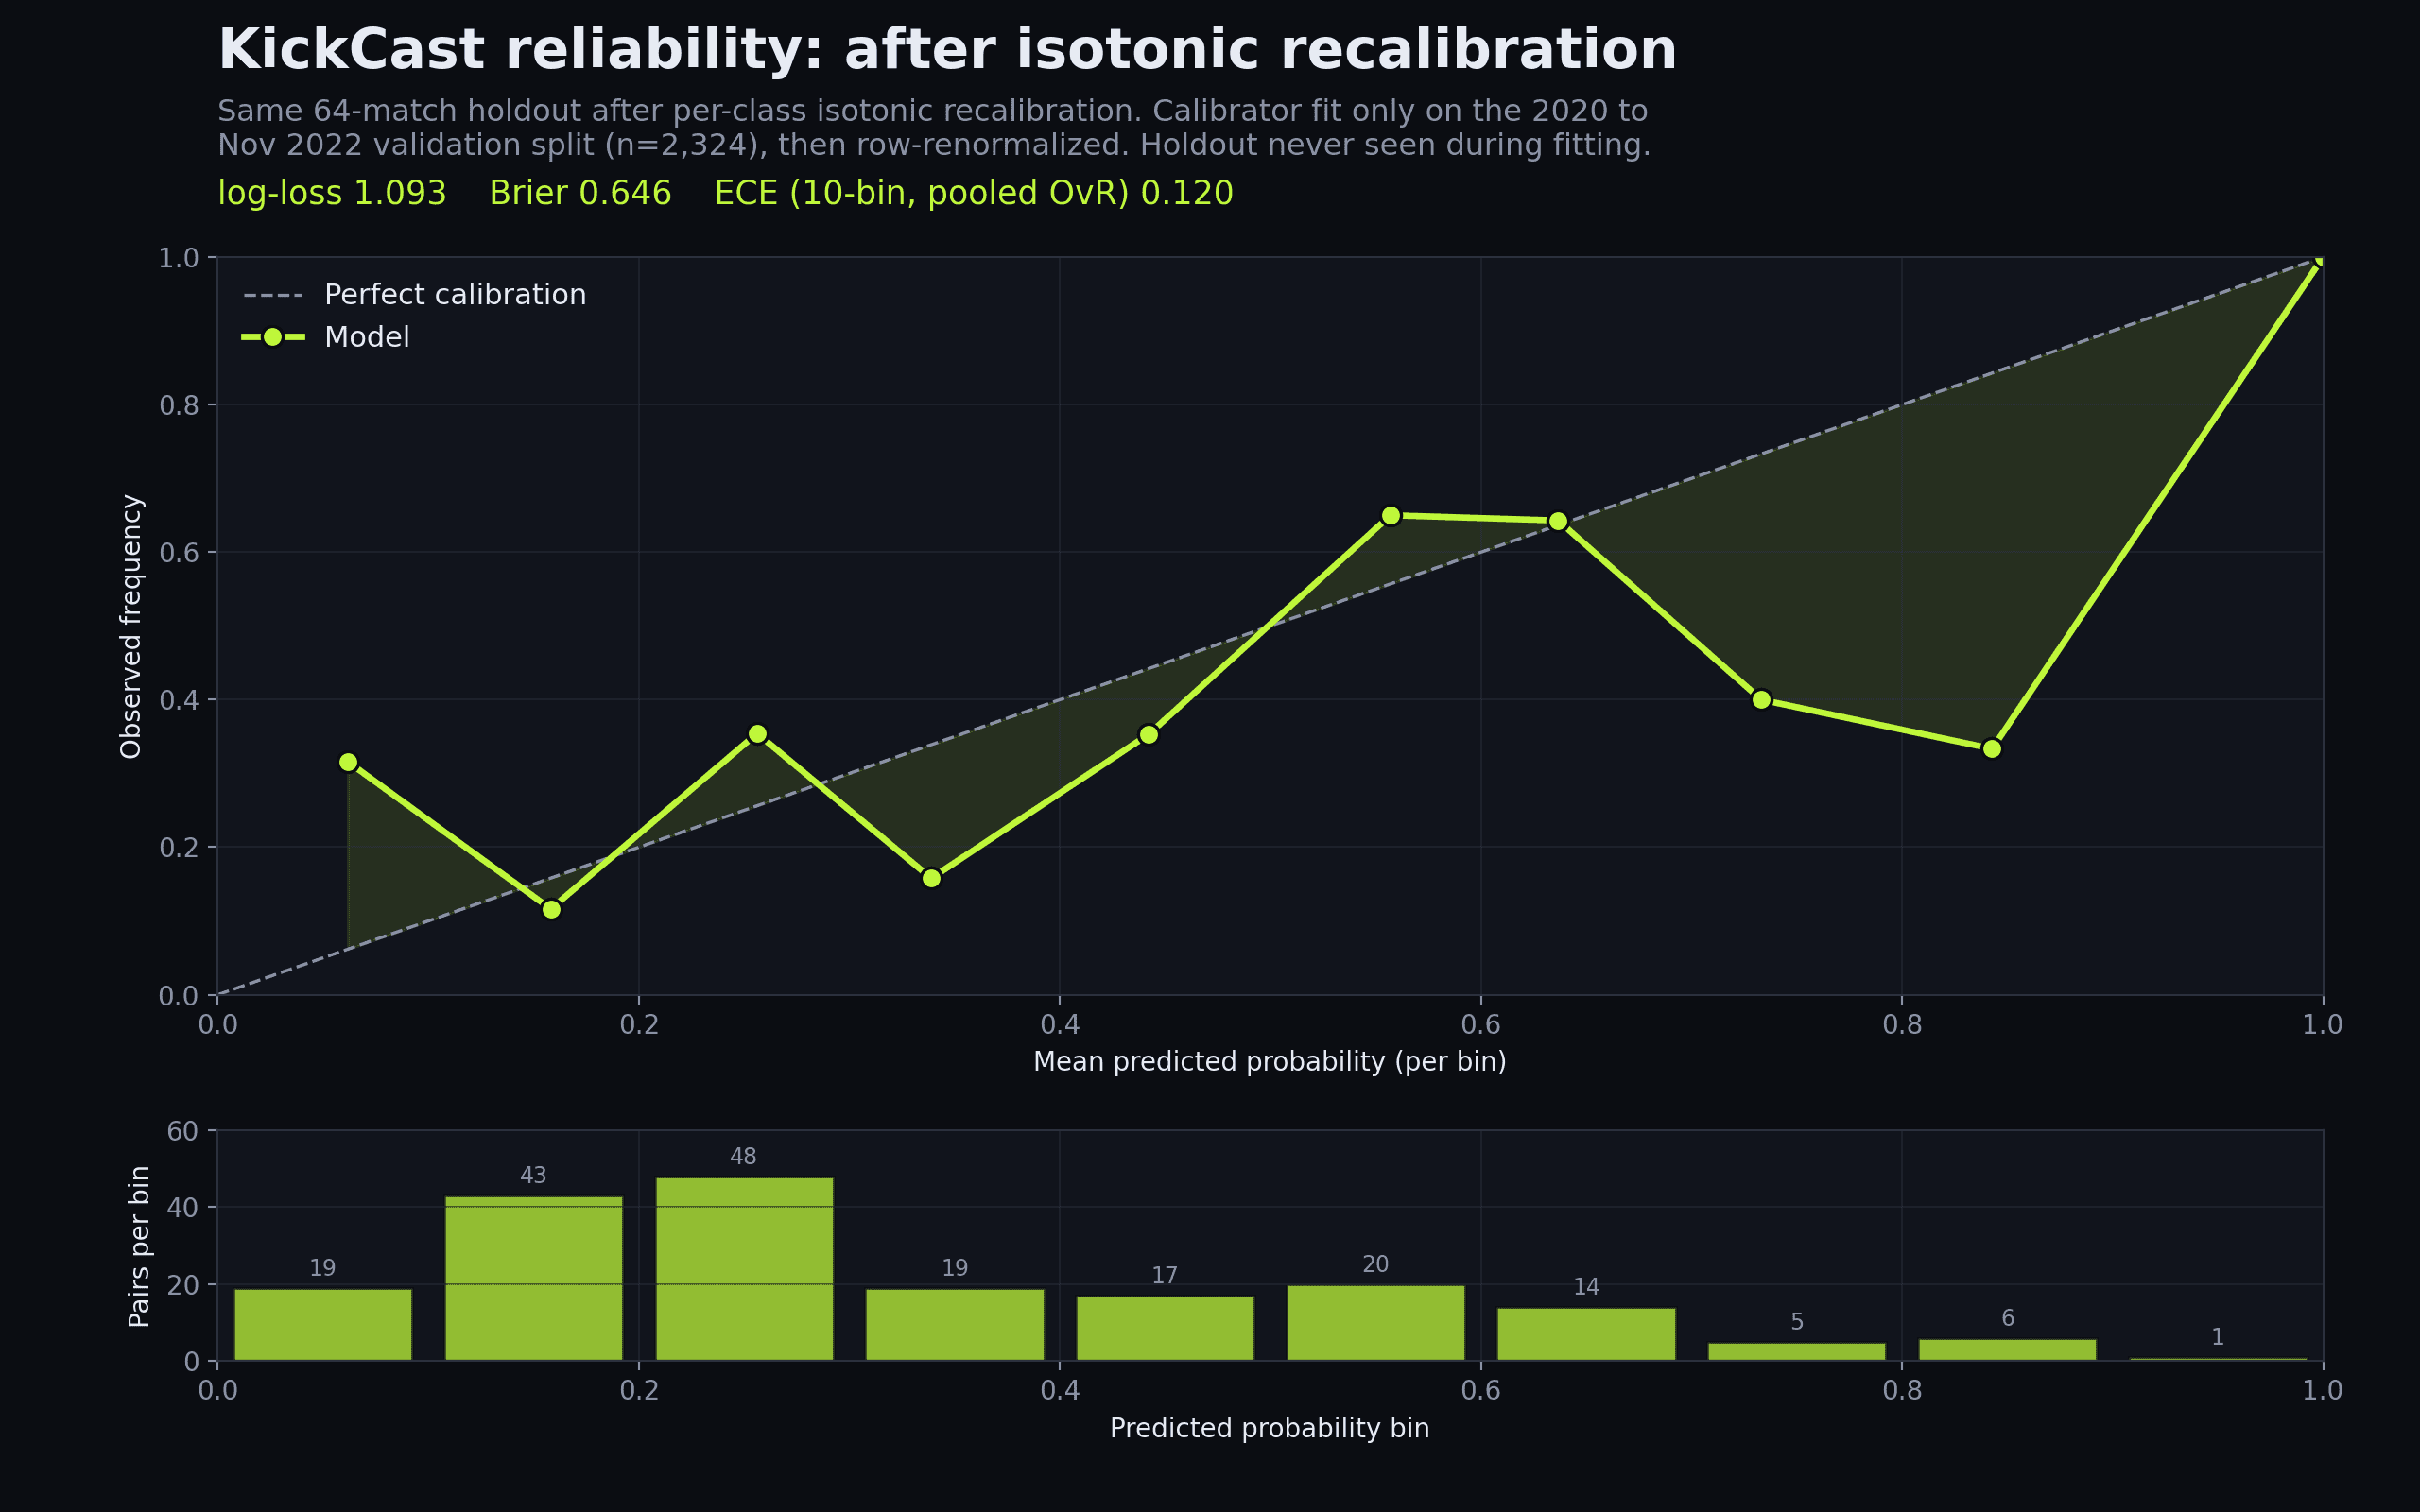
Four accuracy figures, one story (so a spot-check, or the chatbot, never reads them as a wobble): 45.3% (29/64) is top-1 on the 64-match 2022 World Cup holdout BEFORE recalibration; 50.0% is the SAME holdout AFTER per-class isotonic recalibration (a monotone side-effect of calibrating, documented in the calibration study); 56.25% is raw accuracy on the separate 3,552-match chronological test split, which recalibration nudges to 58.3%. All four are real and consistent, not a contradiction, and accuracy is deliberately not the headline: the calibration study optimizes log-loss and ECE (proper scoring), not top-1.
38 vs 31 features: 38 counts every column of the released 21,371-row…
38 vs 31 features: 38 counts every column of the released 21,371-row master matrix (repo LESSONS.md); the report models on the 31 engineered delta features inside it.
7 vs 14 models: the card's seven are the core classical classifiers…
7 vs 14 models: the card's seven are the core classical classifiers; the report's fourteen add the majority-class baseline, LightGBM and CatBoost, an isotonic-calibrated weighted ensemble, and three KickCastNet generations.
Two simulation runs exist: the committed course-submission run (Spain 16.5%)…
Two simulation runs exist: the committed course-submission run (Spain 16.5%) and a later calibrated-ensemble run baked into the live dashboard (Spain 20.5%). The repo's simulation-results README documents which is which; the README attributes the committed run to the tuned XGBoost while the report abstract describes it as KickCastNet v3-calibrated.
The demo's 'Real model output' panel republishes the live dashboard's own data…
The demo's 'Real model output' panel republishes the live dashboard's own data (Spain 20.52%): the published KickCastNet v3 run, 10,000 Monte-Carlo iterations, dashboard data generated 2026-04-16, traceable to the model artifact and simulation script behind the live dashboard. The in-page simulator itself remains a simplified, illustrative Elo-style model on synthetic ratings and never produces those numbers.
What I'd improve
Honest read on the 64-match 2022 holdout: the 45.3% top-1 (29/64) sits about at the always-home rate (~44%) and below a naive Elo-favorite (~52%), precisely because the model predicts draws the favorite baselines never do.
So the lever isn't top-1 accuracy, it's calibration, and that is what the project optimizes: it scores on log-loss (a proper scoring rule) with a stacking ensemble and calibration plots. That recalibration is now done and measured in the follow-up calibration study: per-class isotonic regression (fit on the validation split, holdout untouched) cuts holdout log-loss from 1.347 to 1.093 and 10-bin ECE from 0.157 to 0.120 on the 64-match 2022 holdout, and full-test ECE from 0.098 to 0.017 (n=3,552).
That backtest is now live and out-of-sample: against all 72 group-stage games of the 2026 World Cup, the committed forecast (locked before kickoff) called 47 right, 65.3% top-1 versus a 47.2% always-home baseline, with log-loss 0.850 beating the 1.099 uniform. Full scored board at /kickcast-2026.
Still open: knockout-tie forecasting.