
KickCast Calibration Study
isotonic recalibration · 2022 WC holdout
Closes KickCast's stated next step with measured results: on the 64-match 2022 World Cup holdout, isotonic recalibration cuts log-loss from 1.347 to 1.093 and 10-bin ECE from 0.157 to 0.120, documented with before/after reliability diagrams.
Amber bar: observed frequency. Ink tick: mean predicted probability. A calibrated bin lands the bar on the tick.
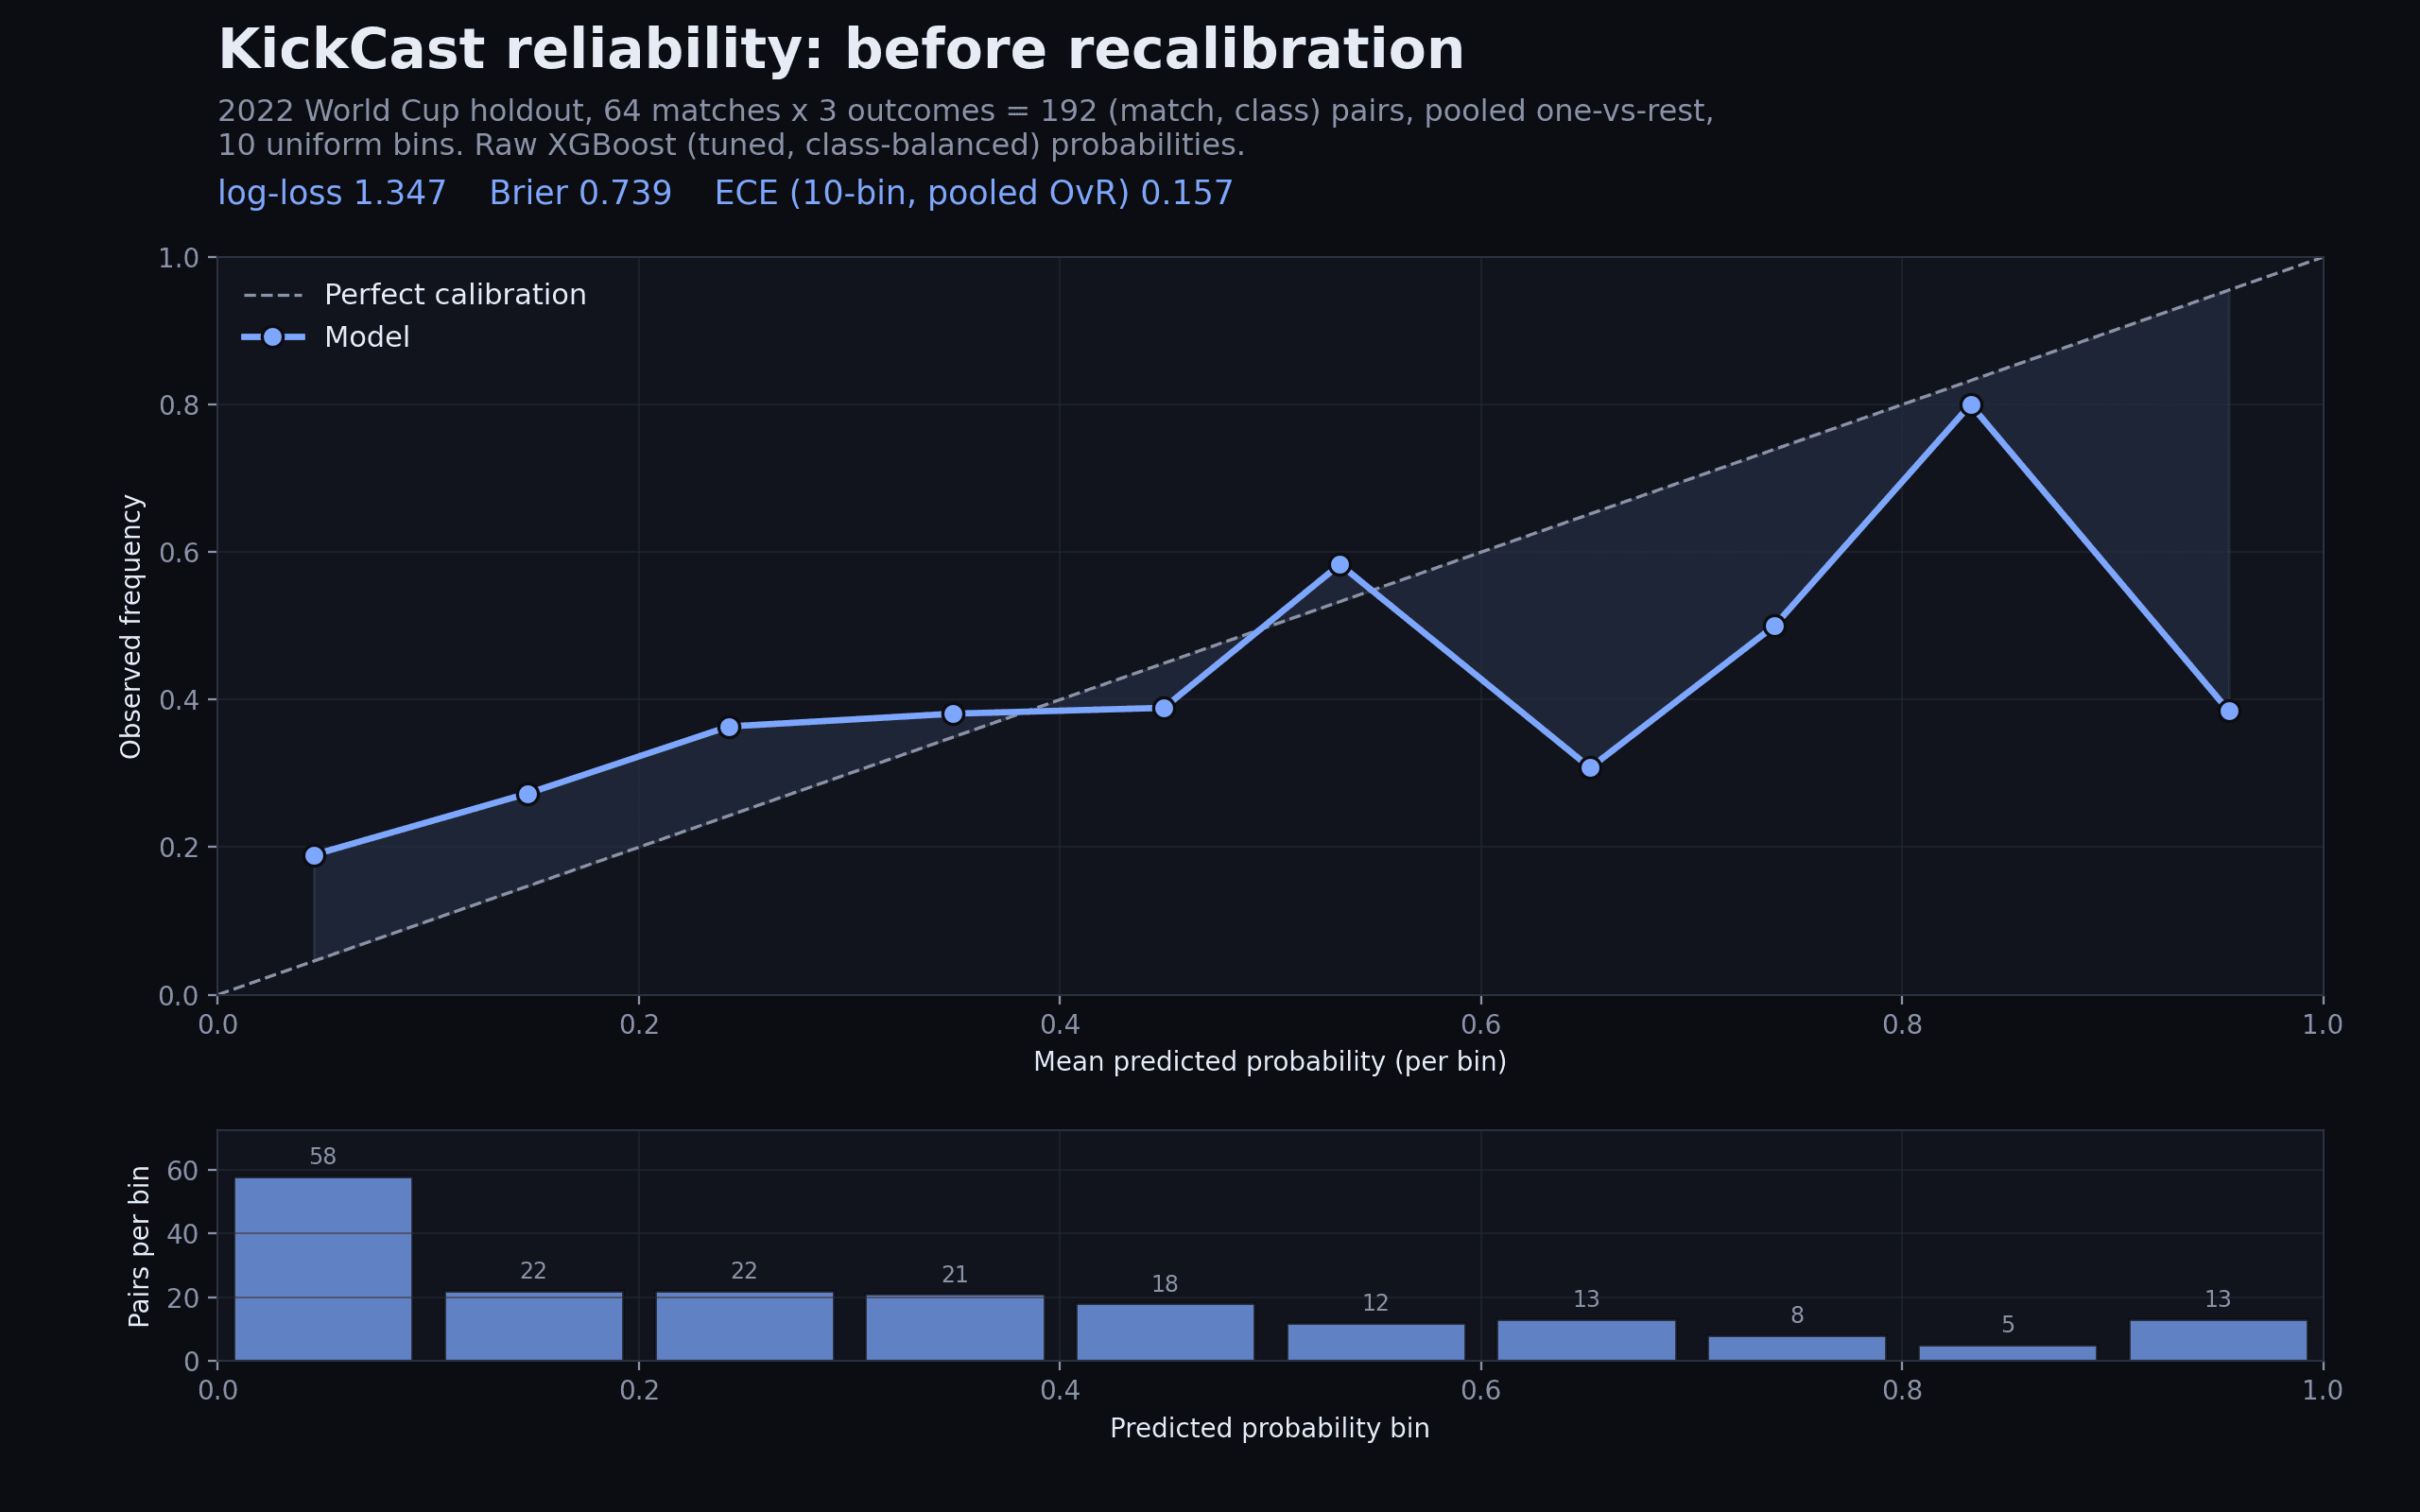
- 0.0-0.1predicted 0.045, observed 0.190, n=58 · gap 0.14
- 0.1-0.2predicted 0.147, observed 0.273, n=22 · gap 0.13
- 0.2-0.3predicted 0.243, observed 0.364, n=22 · gap 0.12
- 0.3-0.4predicted 0.349, observed 0.381, n=21 · gap 0.03
- 0.4-0.5predicted 0.449, observed 0.389, n=18 · gap 0.06
- 0.5-0.6predicted 0.533, observed 0.583, n=12 · gap 0.05
- 0.6-0.7predicted 0.652, observed 0.308, n=13 · gap 0.34
- 0.7-0.8predicted 0.739, observed 0.500, n=8 · gap 0.24
- 0.8-0.9predicted 0.833, observed 0.800, n=5 · gap 0.03
- 0.9-1.0predicted 0.955, observed 0.385, n=13 · gap 0.57
- Log-loss1.347 → 1.09395% CI of change [-0.421, -0.101]
- Brier (multiclass)0.739 → 0.64695% CI of change [-0.151, -0.036]
- ECE (10-bin OvR)0.157 → 0.12095% CI of change [-0.101, +0.026] · crosses zero
Honest read: with n=64 the ECE gain cannot be certified from the holdout alone (CI crosses zero). The full-test robustness check (n=3,552) carries it: ECE 0.098 → 0.017.
Real data, nothing synthetic: every bar is the saved KickCast model on the 64 real matches of the 2022 World Cup (192 pooled one-vs-rest pairs), the exact data behind the published reliability diagrams, regenerated with a fidelity gate against the study results. CIs: percentile bootstrap, B=10,000.
Real study data, nothing synthetic: the 10 reliability bins are the saved KickCast model's predictions on the 64-match 2022 World Cup holdout, regenerated from the model artifact with a fidelity gate against the published study; metrics and bootstrap CIs are copied verbatim from results.json and bootstrap_ci.json.
KickCast's honest self-review said the lever is calibration, not top-1 accuracy. This study completes that work on the real model and the real holdout. The saved tuned, class-balanced XGBoost artifact was loaded and first verified to reproduce the project's published test metrics exactly (log-loss 1.0308, accuracy 56.25% on the 3,552-match test split), then scored on the 64 matches of the 2022 World Cup, a holdout never touched during training or tuning.
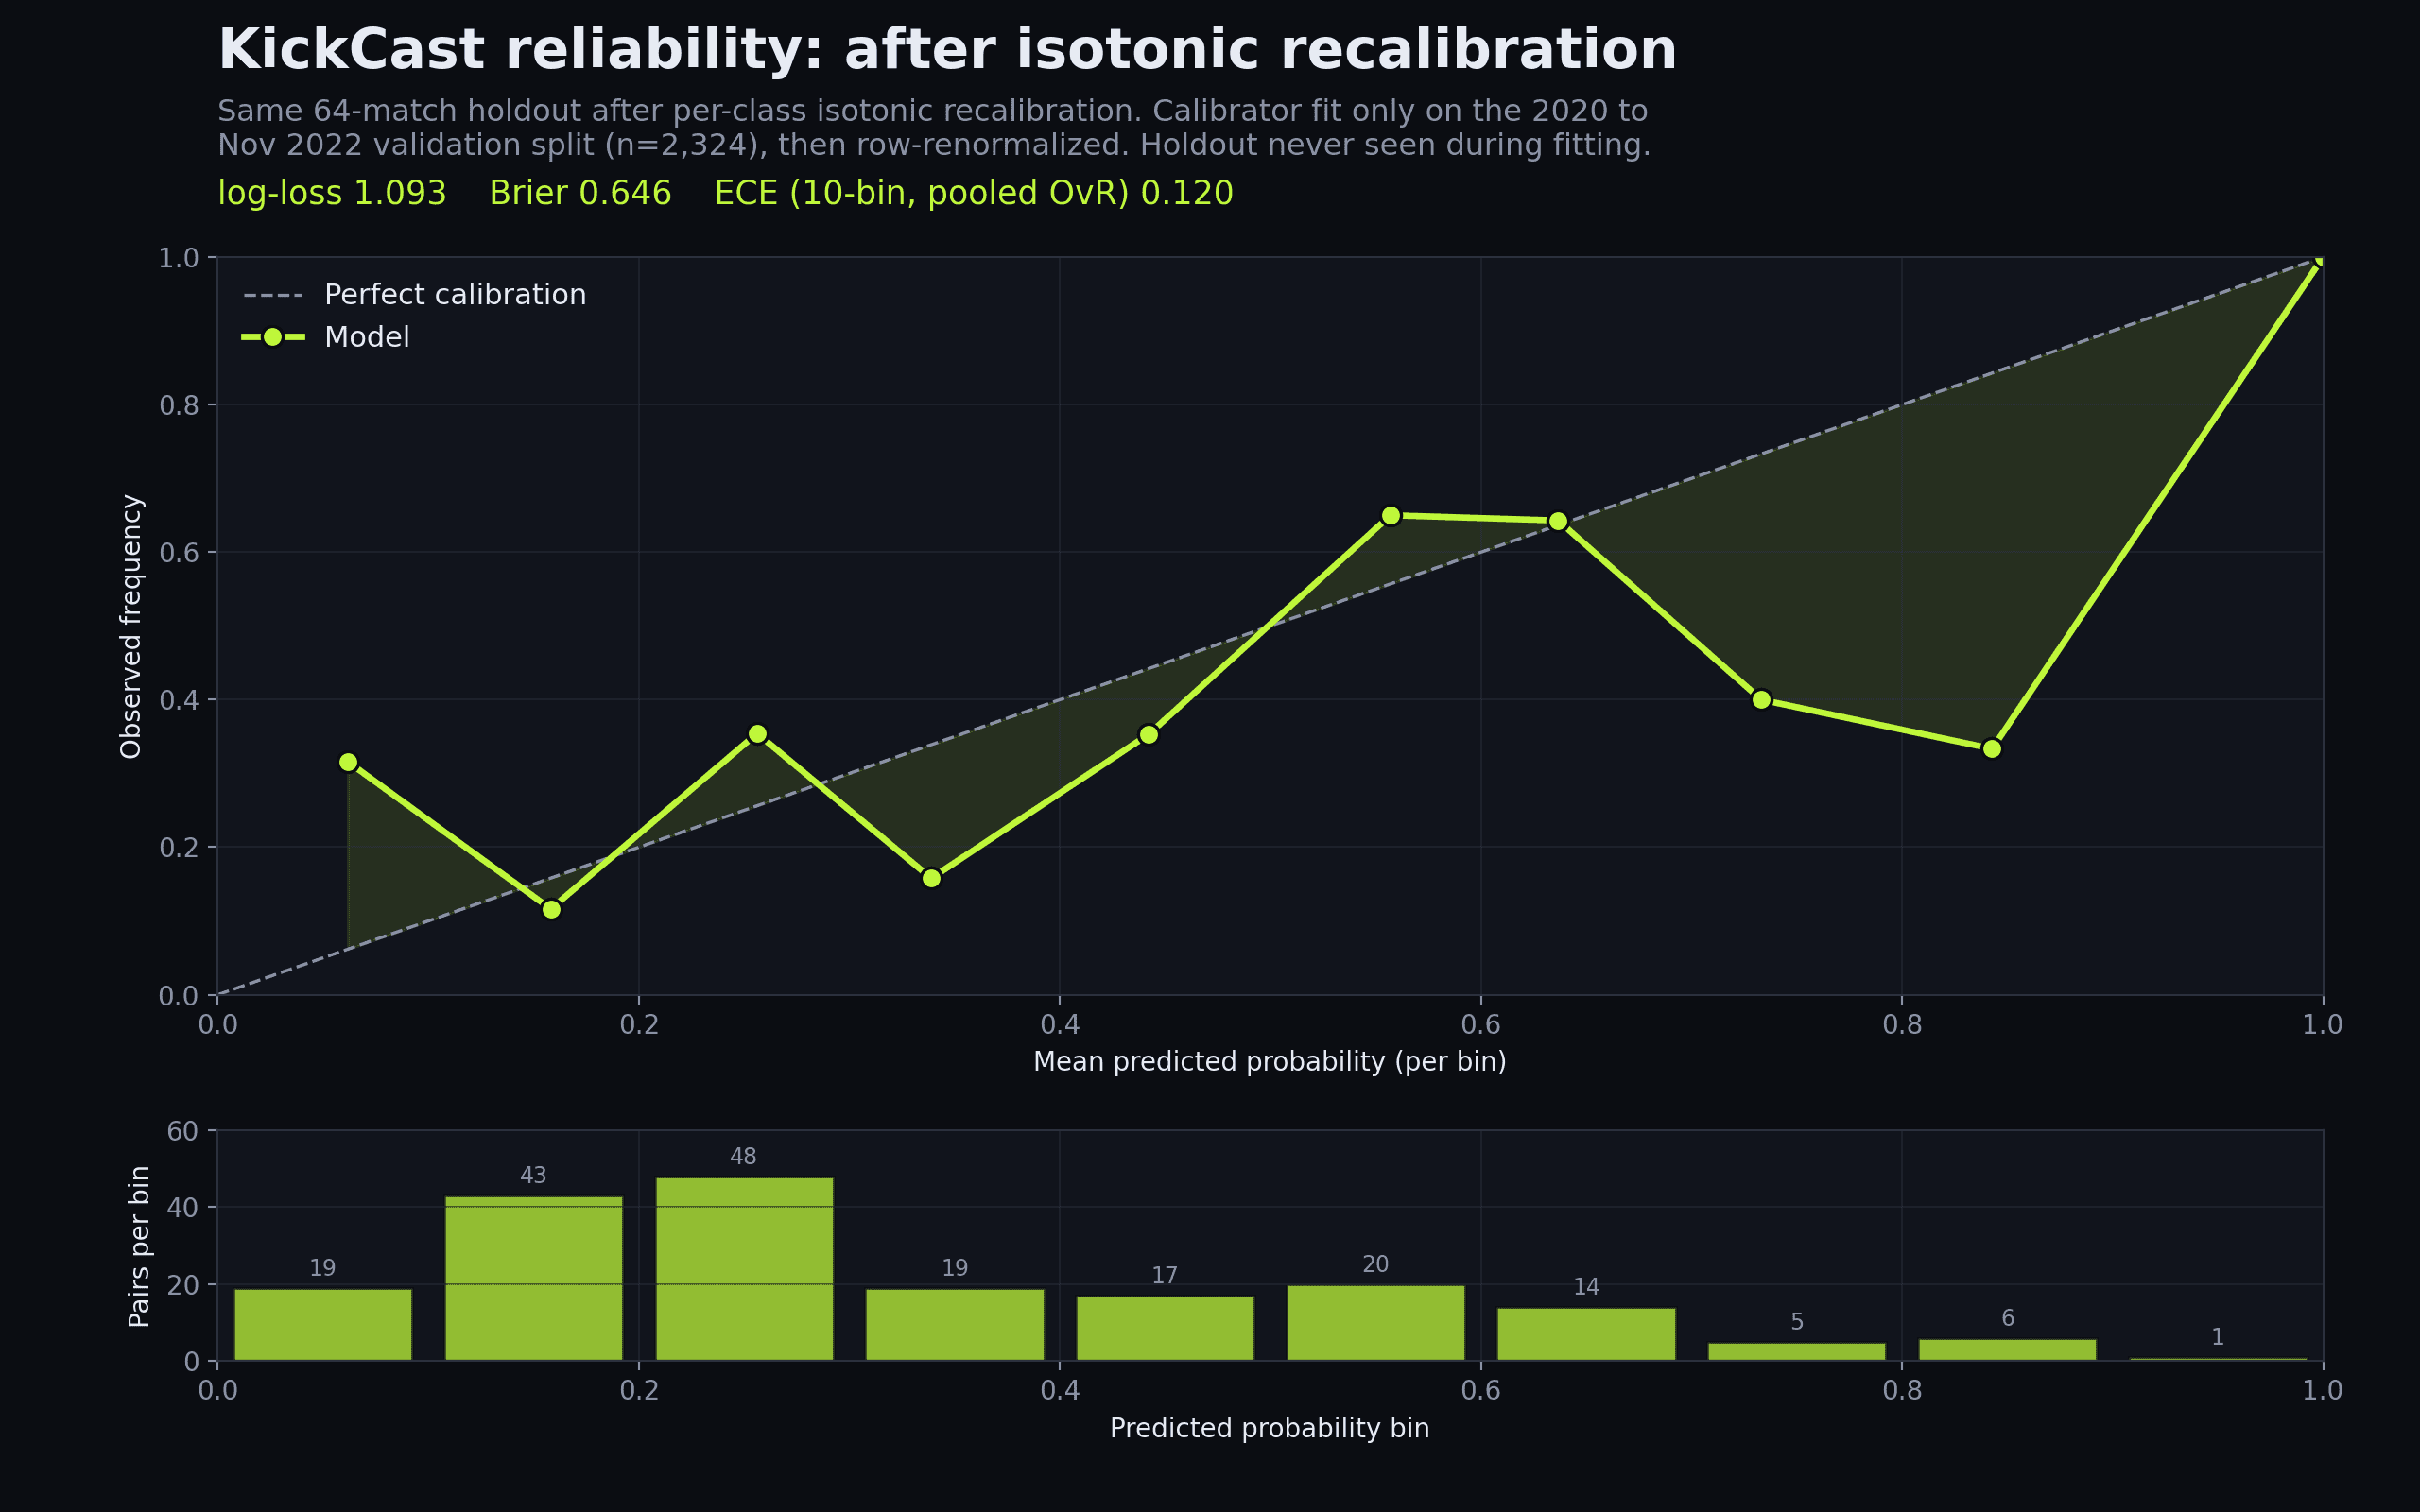
Reliability is measured as pooled one-vs-rest over 192 match-class pairs in 10 uniform bins: before recalibration the model shows ECE 0.157, log-loss 1.347 and multiclass Brier 0.739, under-confident at low probabilities and over-confident above 0.6. A per-class isotonic regression (with row renormalization) was then fit only on the chronologically earlier 2,324-match validation split (2020 to Nov 2022), so the holdout stayed unseen during fitting. After recalibration the same 64 matches score ECE 0.120, log-loss 1.093 and Brier 0.646; top-label ECE falls from 0.247 to 0.148 and top-1 accuracy moves from 45.3% to 50.0%.
Caveat stated plainly: n=64 is a small sample, so per-bin points are noisy and the deltas carry wide uncertainty. As a robustness check the same calibrator was applied to the full 3,552-match test split, where log-loss drops from 1.031 to 0.923 and pooled ECE from 0.098 to 0.017, confirming the correction generalizes beyond the 64-match story.
- Python
- scikit-learn
- XGBoost
- Isotonic regression
- matplotlib
Architecture · saved model → measured calibration
Artifact fidelity check
Load the saved tuned, class-balanced XGBoost and verify it reproduces the published test metrics exactly (log-loss 1.0308, accuracy 56.25%, n=3,552) before trusting any new number.
Holdout scoring
Predict the 64 matches of the 2022 World Cup, a chronological holdout never used for training or tuning, and keep full 3-class probabilities per match.
Measure miscalibration
Reliability over 192 pooled one-vs-rest pairs, 10 uniform bins with bin counts: ECE 0.157, log-loss 1.347, Brier 0.739 before any correction.
Isotonic recalibration
Per-class isotonic regression, row-renormalized, fit only on the 2,324-match validation split (2020 to Nov 2022) so the holdout stays unseen.
Re-evaluate + robustness
Holdout after: ECE 0.120, log-loss 1.093, Brier 0.646 (n=64, noisy bins disclosed). Full test split: log-loss 1.031 → 0.923, ECE 0.098 → 0.017.
- Brier, multiclass (n=64)
- 0.739 → 0.646
- Full-test ECE (n=3,552)
- 0.098 → 0.017
What I'd improve
The bootstrap CIs are now done (B=10,000, calibrator held fixed across resamples), and they sharpen the honest story: on the n=64 holdout the log-loss delta is -0.253 (95% CI [-0.421, -0.101]) and the Brier delta -0.093 (CI [-0.151, -0.036]), both excluding zero, but the ECE delta of -0.041 (CI [-0.101, +0.026]) crosses zero, so the holdout alone cannot certify the calibration gain. That is exactly why the full-test robustness check (n=3,552, ECE 0.098 to 0.017) carries the calibration claim.
Still open: a head-to-head against temperature scaling and Dirichlet calibration, feeding the calibrated probabilities back into the 10,000-run Monte-Carlo simulation to measure how tournament odds shift, and backtesting across the 2010, 2014 and 2018 cycles.