Image Mosaic Generator
Photos → mosaic art, vectorized
Profile first, vectorize second: a measured 50.13× average speedup over the nested-loop baseline across three image sizes, 2.5× past the course's 20× target.
Each region is matched to its nearest tile in the corpus. Synthetic source + palette, reconstructed in your browser.
Watch a mosaic assemble from tiles in your browser.
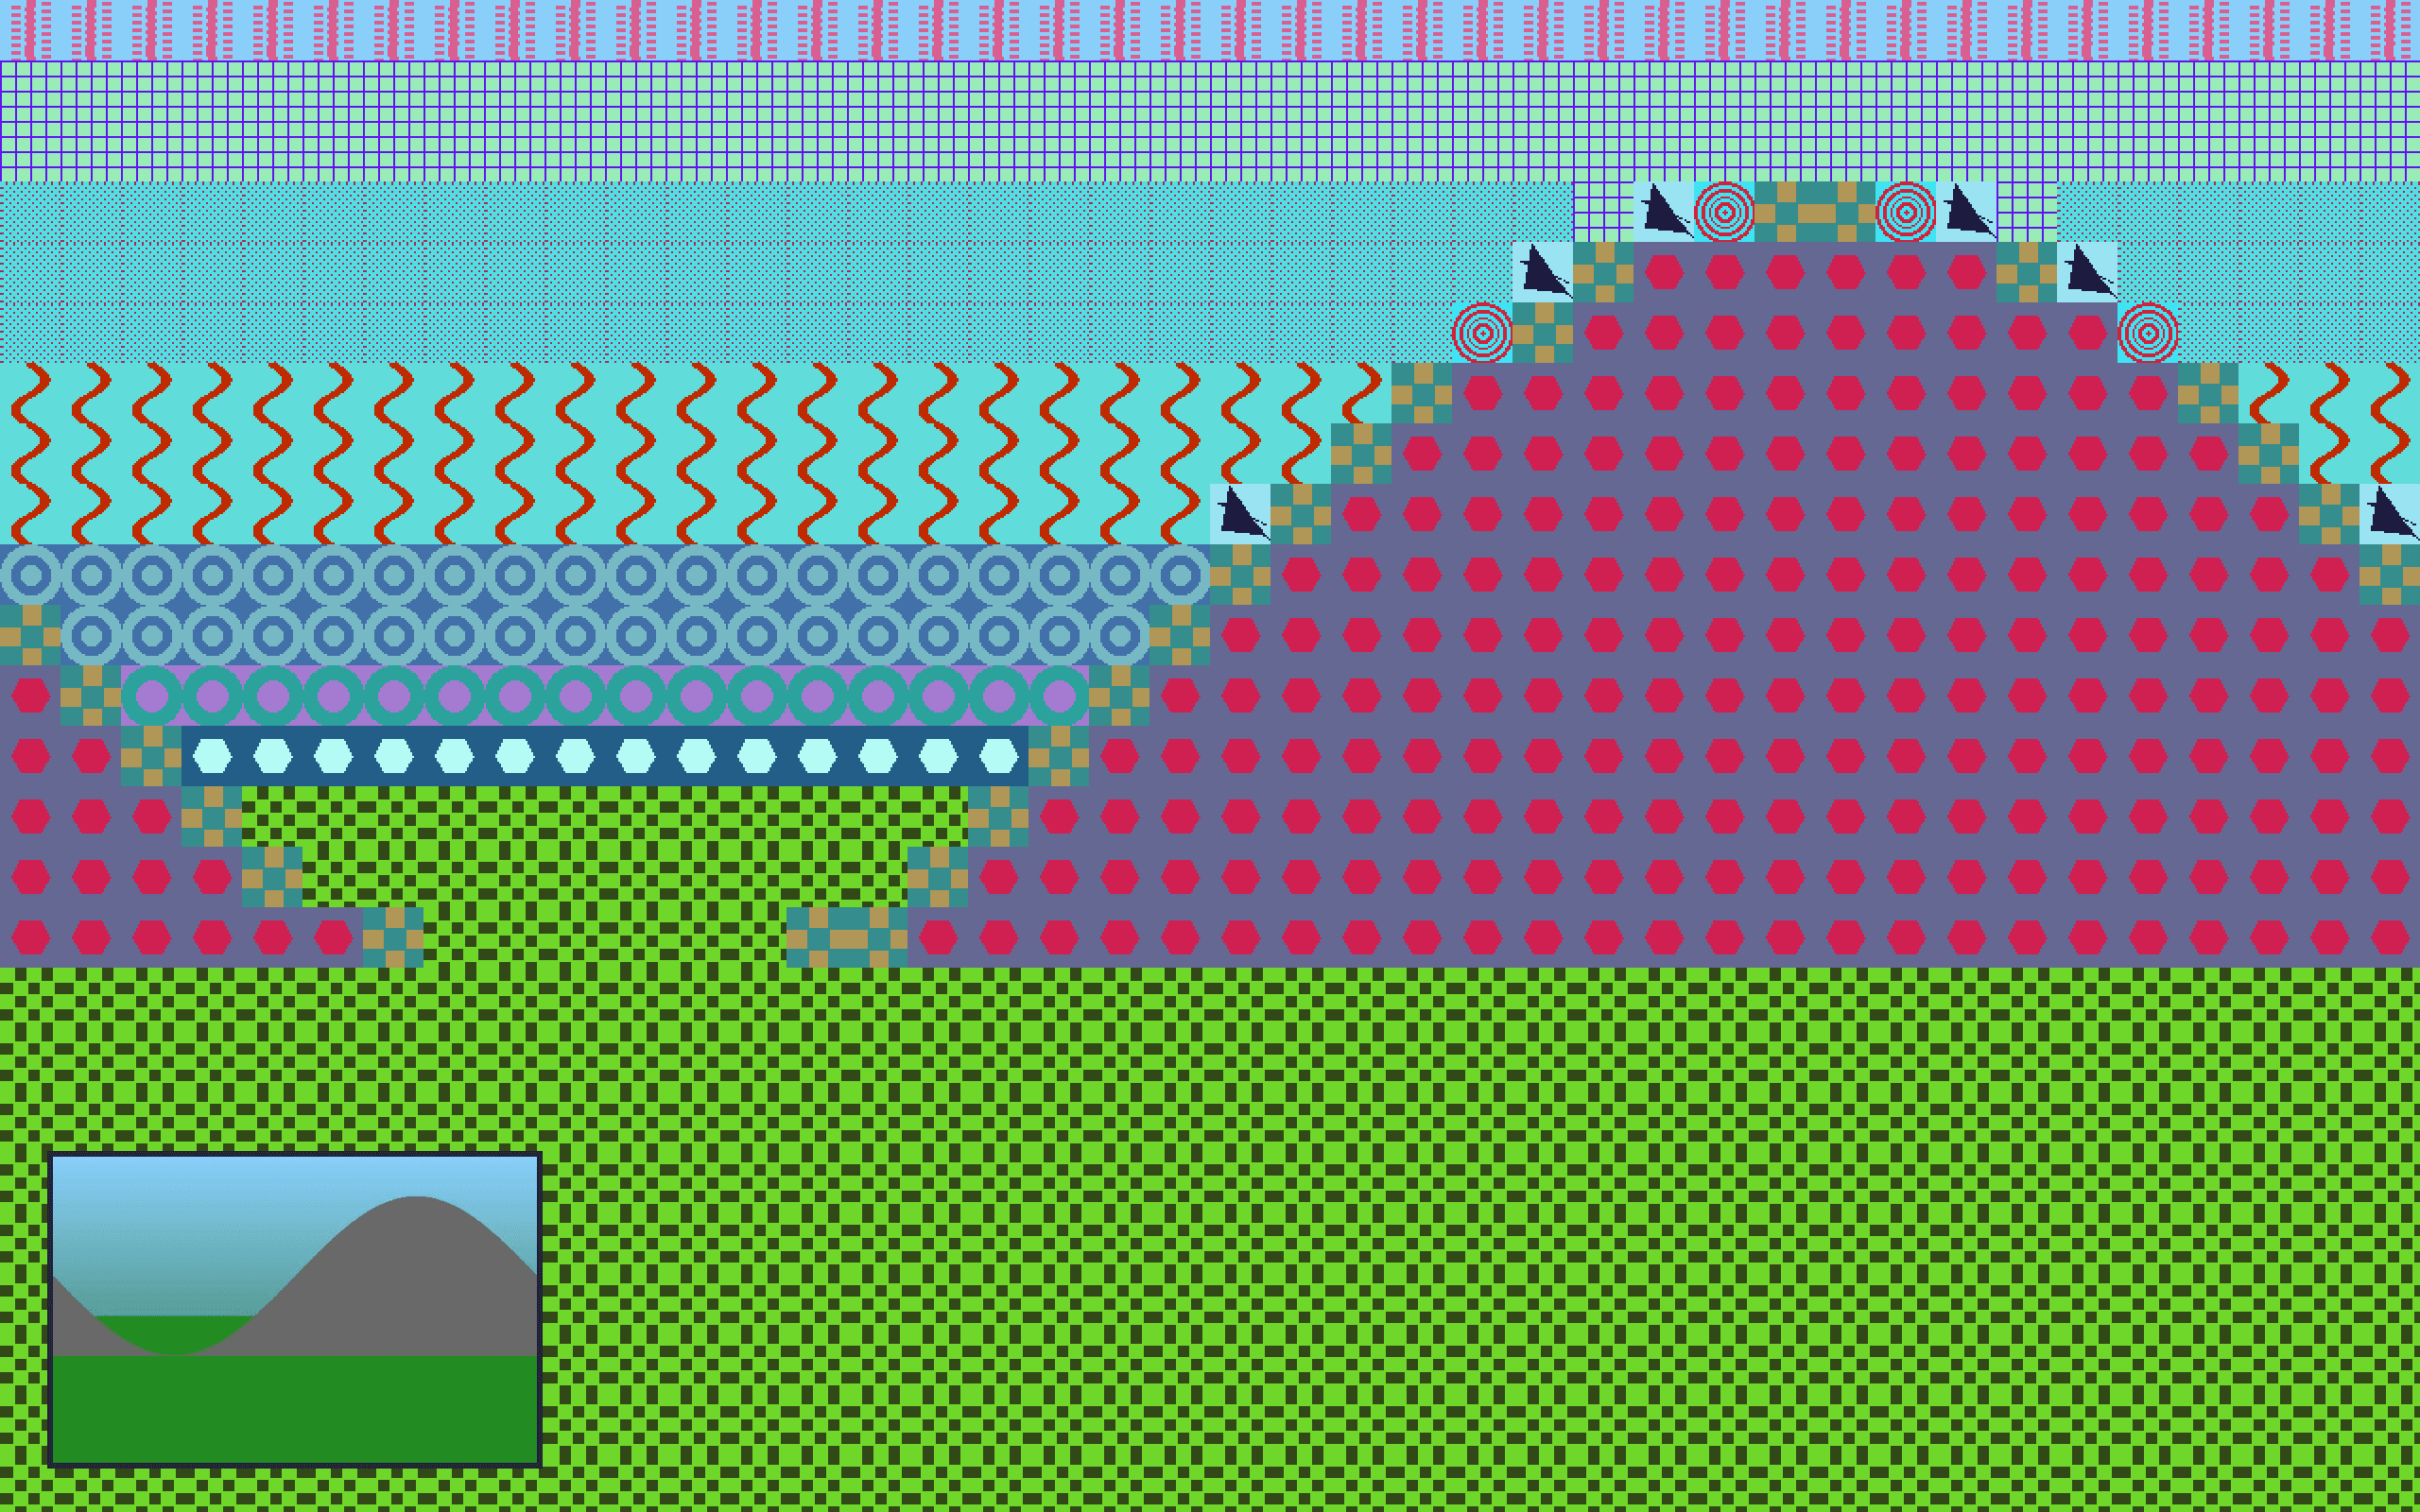
Image Mosaic Generator, a graduate coursework project, turns a photo into mosaic art: it splits the image into a grid, computes each cell's average color with a NumPy reshape/transpose pass, matches every cell to the nearest tile in one broadcast distance calculation against tile colors pre-computed at load time, and reassembles the result with a single vectorized reshape, no Python loops on the hot path. The optimization work is the substance: cProfile and line_profiler locate the bottlenecks, each fix lands one at a time and is re-measured, and the final benchmark runs three image sizes against a nested-loop baseline (77.86× at 256px, 41.67× at 512px, 30.86× at 1024px, a 50.13× average against the course's 20× target). Around the core: K-means color quantization, Canny edge-aware adaptive grids, RGB/LAB matching spaces, an MSE/PSNR/SSIM/histogram quality pipeline (skimage + OpenCV), pickle-cached tile sets, and a six-module package served as a Gradio app deployed to Hugging Face Spaces with five tile sets (256 colors plus gradients, patterns, emojis, and image tiles).
- Python
- NumPy
- OpenCV
- scikit-learn
- scikit-image
- Gradio
- Pillow
- Avg speedup
- 50.13× (target: 20×)
- Throughput
- 2,438 tiles/sec
- SSIM
- 0.87
- PSNR
- 32.4 dB
Where the numbers come from
50.13× vs the repo's 12.3×: the linked performance report PDF benchmarks…
50.13× vs the repo's 12.3×: the linked performance report PDF benchmarks the optimized package against a deliberately slow nested-loop baseline at three image sizes (77.86×, 41.67×, 30.86×); the GitHub repo's own report measures a 12.3× vectorization gain on a single 512×512 run (2.34s to 0.19s). Different baselines, both measured.
SSIM 0.87, PSNR 32.4 dB and 2,438 tiles/sec come from the repo's…
SSIM 0.87, PSNR 32.4 dB and 2,438 tiles/sec come from the repo's performance report (512×512 test standard; throughput peak at the 16×16 grid). The linked PDF reports the speedup benchmark only.
What I'd improve
The 50× headline is measured against a deliberately slow nested-loop baseline, and the report says so: the first build was already partially vectorized. The comparison still owed is optimized vs that partially vectorized version, plus a unit-test suite that pins the reshape/transpose math to the loop-based output so a future refactor can't silently corrupt tile placement.